When you hear about a player’s WAR score in baseball, you might wonder, “What makes it good?” WAR, or Wins Above Replacement, measures how much better a player is compared to a replacement-level player. A good WAR score highlights a player’s value to their team.
Here’s a quick breakdown of what WAR scores mean:
0 to 1: Replacement-level performance, like a minor league call-up.
2 to 2.9: A solid starter who helps the team.
3 to 3.9: An above-average player and a key contributor.
4 to 5: All-Star level, making big impacts.
5+: Superstar status, possibly MVP-worthy.
This metric helps you understand if a player is just decent, a good war contributor, or a true game-changer.
Key Takeaways
WAR shows how many wins a player adds over a basic-level player.
A good WAR score depends on the player’s role; above 6 means MVP-level.
Knowing WAR helps compare players from different times and positions fairly.
Use WAR with other stats like wOBA or FIP to see a player’s full impact.
Famous players like Babe Ruth and Mike Trout show how high WAR means great performance.
Understanding WAR in Baseball

What Is WAR?
WAR, or Wins Above Replacement, shows how much a player helps their team. It answers this: How many more wins does this player add compared to a basic-level player? A basic-level player is someone easy to replace, like a minor league call-up or bench player.
Think of WAR as a number that combines everything a player does—hitting, fielding, running bases, and pitching. This makes comparing players simpler, even if they play different positions. For example, a shortstop and a first baseman have different jobs, but WAR shows who helps their team more.
Components of WAR
WAR isn’t just a random number. It’s made from different parts that show how a player performs. Here are the main pieces:
Batting stats: Hits, doubles, triples, and home runs all count toward WAR.
Fielding ability: Defense is measured using special stats like UZR (Ultimate Zone Rating) or DRS (Defensive Runs Saved).
Baserunning: Stealing bases and taking extra bases add to a player’s WAR.
Pitching stats: For pitchers, WAR includes strikeouts, walks, and innings pitched.
WAR connects with the 20/80 scouting scale. A score of 40 means replacement level, and every 10-point jump equals a better WAR. This link shows how scouting and stats work together to judge players.
Why WAR Is a Comprehensive Metric
WAR is great because it shows everything a player does to help their team. Unlike stats like batting average or RBIs, WAR looks at all parts of a player’s game. It also adjusts for things like ballpark size and league averages, making comparisons fairer.
For example, Manny Machado’s 2022 season shows how WAR works. His fWAR (7.4) and bWAR (6.8) were close but slightly different because defense was measured differently. Fangraphs used UZR, while Baseball-Reference used DRS. These differences show that WAR can vary but still gives a clear idea of a player’s value.
By combining all parts of performance, WAR helps people understand what makes a player special. Teams and analysts use it to find good WAR players and game-changers.
How Is WAR Calculated?
Overview of the Calculation Process
WAR might seem tricky, but it’s simpler when explained. It adds up different parts of a player’s game to show their value. These parts include hitting, running, fielding, and pitching. Each part is turned into runs, adjusted for position and league averages.
Here’s a simple breakdown of how WAR is figured out:
Component | What It Means |
|---|---|
Batting Runs | Runs from hitting, using a system to measure value. |
Baserunning Runs | Runs from stealing bases and smart running. |
Grounding into Double Plays | Adjustments for losing runs by hitting into double plays. |
Fielding Runs | Runs saved or lost based on defense. |
Positional Adjustment Runs | Changes based on the difficulty of the player’s position. |
Replacement Level Runs | Runs expected from a basic-level player. |
After adding these parts, the total is changed into wins. This number shows how many wins the player adds compared to a basic-level player.
Differences Between Hitters and Pitchers
WAR is calculated differently for hitters and pitchers. For hitters, it focuses on batting and running, plus their defense. For pitchers, it measures how well they stop runs from scoring.
Aspect | Hitters’ WAR Calculation | Pitchers’ WAR Calculation |
|---|---|---|
Metrics Used | Uses hitting and running stats | Uses ERA or runs allowed stats |
Context Consideration | Limited focus on game situations | Full credit or blame for game situations |
Example of Inconsistency | Hitters get average value for doubles | Pitchers are blamed for all runs allowed |
Suggested Improvement | Use stats that include game situations | Add situational stats for hitters |
For example, hitters get an average value for doubles, but pitchers are blamed for every run scored. This can cause differences, but both methods aim to show a player’s full impact.
Examples of WAR Scores
Let’s see how WAR is calculated step by step. Imagine a pitcher with a WAR of 3.76 based on ERA. Adjustments are made for innings pitched, lowering it by 0.14. The final WAR becomes 3.6.
Step | How It’s Calculated | Result |
|---|---|---|
Adjustment per IP | -0.000682902 per inning pitched | |
Correction | -0.000682902 * 204 innings | -0.14 |
Final WAR Calculation | 3.76 – 0.14 | 3.6 |
For hitters, high WAR scores often come from great hitting and running. Players like Mike Trout have high WAR scores because they help in many ways.
What Makes a Good WAR Score?
Benchmarks for Good WAR Scores
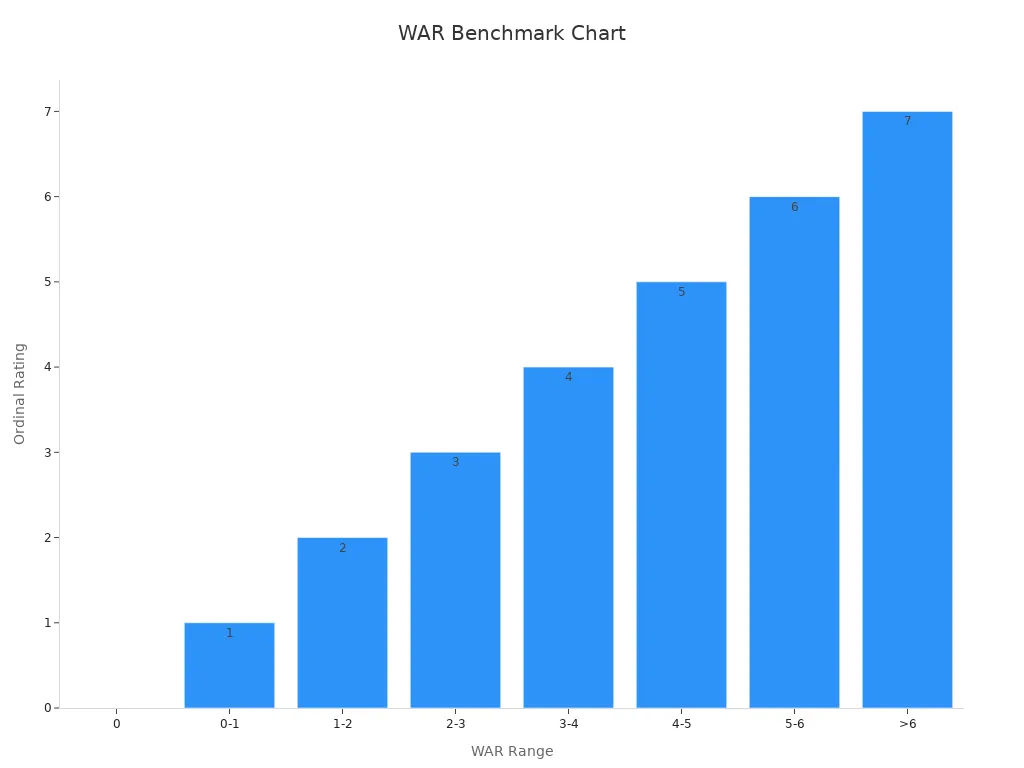
When it comes to understanding what makes a good WAR score, benchmarks are your best friend. These benchmarks help you figure out how valuable a player is to their team. Think of it as a scale that ranges from replacement-level players to MVP candidates. Here’s a quick breakdown:
Player Value | |
|---|---|
0 | Replacement Level |
0-1 | Reserve Player |
1-2 | Role Player |
2-3 | Solid Starter |
3-4 | Good Player |
4-5 | All-Star |
5-6 | Superstar |
>6 | MVP Candidate |
For example, a player with a WAR of 2-3 is considered a solid starter. They’re reliable and contribute consistently. On the other hand, a WAR above 6 puts a player in MVP territory. These are the game-changers who can carry a team on their shoulders.
Here’s a visual representation of these benchmarks to make it even clearer:

So, when you hear about a player’s WAR, you can use these benchmarks to gauge their impact. It’s a simple way to separate the good from the great.
Good WAR for Different Player Roles
Not all players are created equal, and neither are their WAR scores. A good WAR depends on the role a player fills on the field. For example, a superstar like Mike Trout consistently posts high WAR scores because he excels in multiple areas—hitting, fielding, and baserunning.
Let’s compare some players to see how WAR varies by role:
Player Role | WAR Score Comparison | Confidence Interval |
|---|---|---|
Lower than Trout | Wider confidence range | |
Robinson Cano | Lower than Trout | Wider confidence range |
Mike Trout | Higher than others | Narrower confidence range |
As you can see, Trout’s WAR is higher because he contributes across the board. Meanwhile, players like Cabrera and Cano, while still valuable, don’t match Trout’s all-around impact.
For pitchers, a good WAR often comes from preventing runs and pitching deep into games. A starting pitcher with a WAR of 4 or more is usually an All-Star. Relief pitchers, on the other hand, might have lower WAR scores because they pitch fewer innings.
So, when evaluating a player’s WAR, always consider their role. A good WAR for a shortstop might not look the same as a good WAR for a closer, but both can be equally valuable in their own way.
Historical Examples of Good WAR Scores
Looking at history can give you a better sense of what makes a good WAR score. Some players have set the bar incredibly high, showing just how impactful a high WAR can be.
Take Babe Ruth, for example. In 1923, he posted a staggering WAR of 14.1. That’s the kind of number that defines a season and cements a legacy. More recently, Mike Trout has consistently delivered WAR scores above 8, proving his dominance in the modern era.
Here are a few standout seasons:
Barry Bonds (2001): WAR of 11.9, fueled by his record-breaking 73 home runs.
Mookie Betts (2018): WAR of 10.6, thanks to his combination of hitting, fielding, and baserunning.
Pedro Martinez (1999): WAR of 9.7, showcasing his dominance as a pitcher.
These examples show that a good WAR score isn’t just about numbers. It’s about how a player’s performance translates into wins for their team. When you see a player with a WAR above 6, you’re looking at someone who’s making a huge difference every time they step on the field.
Why Is WAR Important in Baseball Analytics?

Comparing Players Across Eras
Have you ever thought about comparing players from different times? Baseball has changed a lot, but WAR helps make fair comparisons. It works like a translator for baseball stats from any era.
WAR adjusts for things like league averages, ballpark sizes, and playing styles. This means you can compare a 1920s slugger to today’s power hitters. For example, Babe Ruth’s amazing 14.1 WAR in 1923 can be compared to Mike Trout’s steady WAR scores above 8.
Stats also show how useful WAR is. Over seven eras, differences in OPS (On-base Plus Slugging) and winning percentage match up with WAR scores. Check out this table:
Era | OPS Contribution to Wins | Correlation Significance |
|---|---|---|
1 | Yes | .001 |
2 | Yes | .001 |
3 | Yes | .001 |
4 | Yes | .001 |
5 | Yes | .001 |
6 | Yes | .001 |
7 | Yes | .001 |
Here’s a chart showing the steady correlation:
With WAR, you can see if a player’s skills would shine in any era. It’s the best tool for comparing baseball’s past and present.
Role in Team Decision-Making
Building a winning team is easier with WAR. It sums up a player’s total value in one number. This helps managers decide who should stay on the team or be replaced.
Imagine choosing between two players. One has a WAR of 4, and the other has a WAR of 2. The player with the higher WAR clearly helps the team more. WAR also helps teams spend money wisely by picking players who give the most value.
Here’s how WAR compares to other stats for team decisions:
Metric | What It Measures | How It Helps Teams |
|---|---|---|
WAR | Shows impact compared to replacement players | |
FIP | Pitcher’s control over outcomes | Judges pitching skill without defense effects |
wOBA | Value of each hit | Shows overall hitting contribution |
WAR isn’t just numbers—it helps teams make smarter choices. It finds players who can boost team performance and lead to wins.
Advantages Over Traditional Stats
Traditional stats like batting average and RBIs are helpful but limited. They don’t show everything a player does. WAR combines hitting, fielding, running, and pitching into one number. This makes it easier to see a player’s full impact.
For example, batting average only shows how often a player gets hits. It doesn’t show how important those hits are. WAR values every part of a player’s game, from home runs to stolen bases.
WAR also adjusts for outside factors like ballpark size and league averages. This makes it a fairer way to compare players.
If you want a stat that shows everything a player does, WAR is the best choice. It’s not just a number—it’s a way to see who truly helps their team win.
Limitations of WAR
Challenges in Calculation
WAR is a helpful stat, but it’s not simple. Figuring it out can be confusing, even for baseball experts. One tricky part is defining a “replacement-level” player. This changes every season because league talent and conditions are always shifting.
Other tough parts include adjusting for positions and estimating fielding or baserunning runs. These need deep analysis and often use guesses. Here are some challenges:
Replacement level doesn’t always match the talent available.
Positional adjustments need careful study of each position’s difficulty.
Fielding and baserunning stats rely on limited data and estimates.
These issues show that while WAR is helpful, it’s not perfect. Knowing how it’s calculated helps you understand its limits.
Criticisms of WAR
Not everyone agrees that WAR is the best stat. Some say it’s too complicated and not always consistent. Different sites, like Fangraphs and Baseball-Reference, calculate WAR in different ways. This causes debates about which one is correct.
Defensive stats also make things harder. They can change a lot from year to year because of small data samples. This makes them less reliable. Plus, fielding is less important now since pitching plays a bigger role in stopping runs. This raises questions about how WAR measures defense.
Here’s a table of common critiques:
Critique/Limitations | Description |
|---|---|
WAR’s detailed formulas can confuse even stat-savvy people. | |
Differences in calculations | Various websites calculate WAR differently, leading to disagreements. |
Unsteady defensive stats | Defensive numbers can change a lot yearly, making them less trustworthy. |
Defining replacement level | It’s hard to agree on what a replacement-level player is since it changes with league talent and season conditions. |
Using WAR Alongside Other Metrics
You shouldn’t only use WAR to judge players. While it’s great at combining stats, it has flaws. Adding other metrics gives a clearer picture. For example, WAR doesn’t show uncertainty or cover every game situation. Stats like wOBA (weighted On-Base Average) or FIP (Fielding Independent Pitching) can help fill these gaps.
Here’s why using multiple stats works:
Evidence Type | Description |
|---|---|
Combines Contributions | |
Media Use | It’s popular in media, showing its importance. |
Player Value | Teams use WAR to decide trades and salaries. |
Limits | WAR’s flaws, like missing uncertainty, can be fixed with other stats. |
By mixing WAR with other stats, you’ll see a player’s value more clearly. It’s like using different tools for different tasks—you’ll always have the right one.
Understanding what makes a good WAR score can change how you see baseball. It’s not just a number—it’s a complete measure of a player’s value.
WAR evaluates everything a player does, from hitting to fielding.
It shows how many wins a player adds compared to a replacement-level player.
Legends like Babe Ruth and Hank Aaron had high WAR scores, proving its reliability.
Adjustments for eras and ballparks make it fair for comparisons.
By using WAR, you’ll see the game in a whole new way. Combine it with other stats, and you’ll have a powerful tool for evaluating players. ⚾
FAQ
What does a WAR score of 0 mean?
A WAR score of 0 means the player is at replacement level. This means they perform like a minor league or bench player. It’s not terrible, but it’s not impressive either.
Why do websites calculate WAR differently?
Websites like Fangraphs and Baseball-Reference use different formulas for WAR. They focus on things like defense or baserunning in unique ways. These differences cause small changes in scores, but both aim to show player value.
Can pitchers and hitters have the same WAR?
Yes, pitchers and hitters can have similar WAR scores. Pitchers earn WAR by stopping runs, while hitters earn it by batting, fielding, and running bases. WAR adjusts for these roles to make fair comparisons.
Is a high WAR always better?
A high WAR usually shows a player is very helpful. But the player’s role matters. A relief pitcher with a WAR of 2 might be great, while a starter with the same score might be average. Always think about their position.
How can I use WAR to compare players?
Use WAR ranges to compare players. For example, a WAR of 5 means All-Star level, while 2-3 means a solid starter. WAR also adjusts for positions and eras, making comparisons fairer.
Tip: Combine WAR with stats like wOBA or FIP for better results.
